 International
 Singapore
 Malaysia
 Thailand
 Vietnam
Your shopping cart is empty!

IRIV PiControl - Logging Real-time Data to CSV
- Abdulrahman Alhamed
- 22 Mar 2024
- Tutorial
- Advanced
- 295
Hi and welcome back to another tutorial on using IRIV PiControl and Node-RED. Today, we'll learn how to log real-time data into a CSV file using data from a power meter. If you haven't seen our previous tutorial on using a power meter with IRIV, I suggest checking it out first. This tutorial will give you a basic understanding of how data logging works in Node-RED.
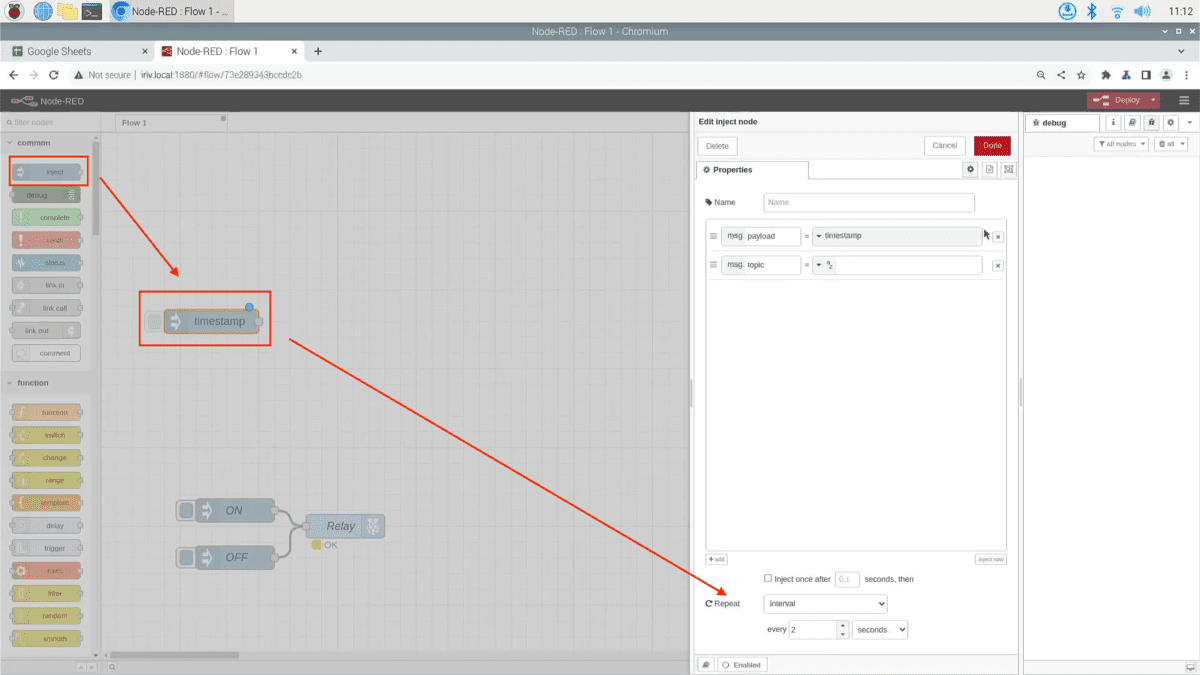
Firstly, we are going to use an inject node, open its properties, then in the Repeat box, choose how often you want your data to be recorded.
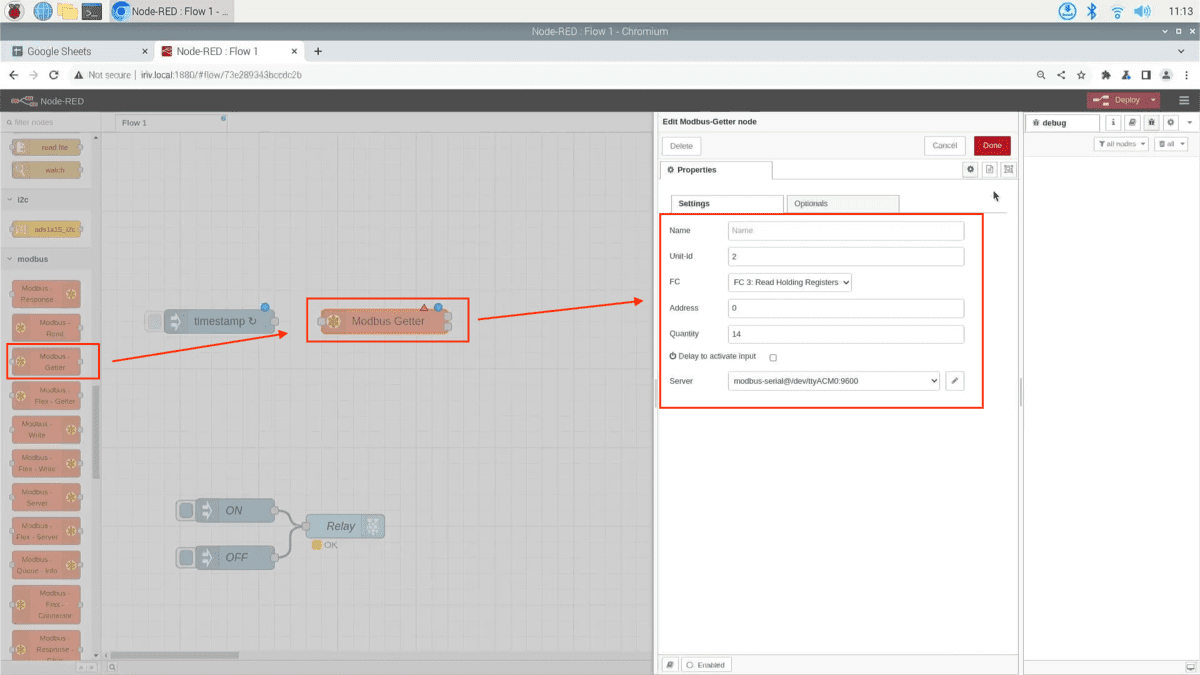
Next, drag the Modbus-Getter node, open its properties, and configure these parameters according to the Modbus device you're using. For more information about these settings, please watch our previous tutorial to learn more.
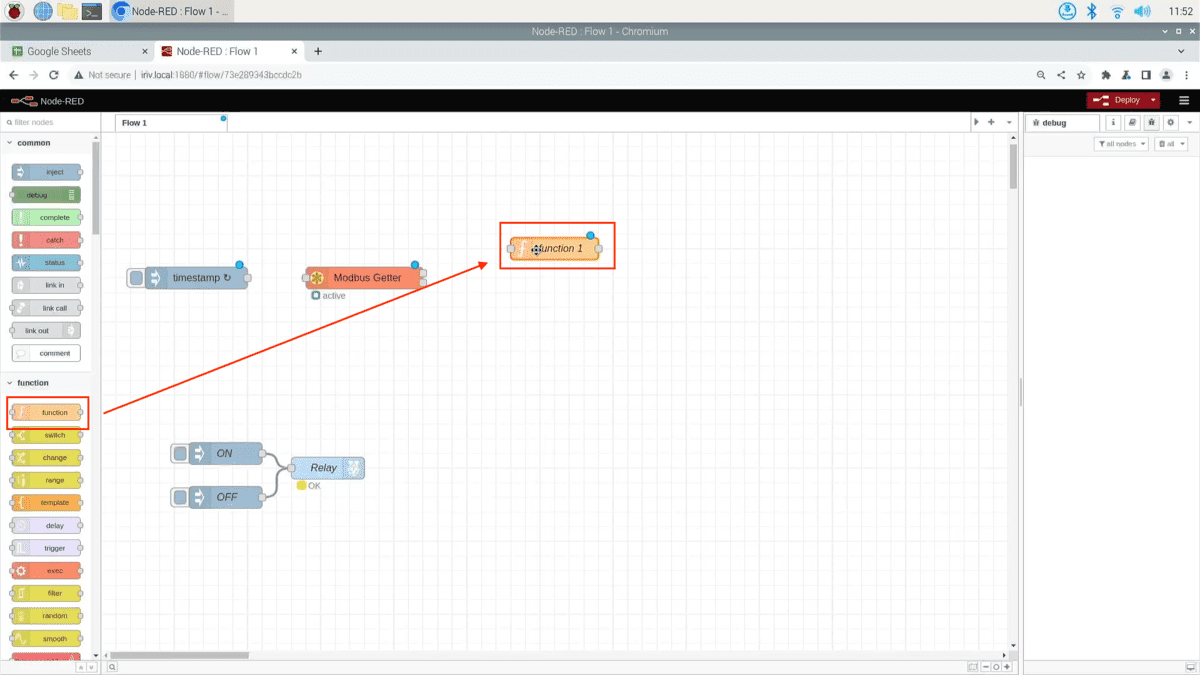
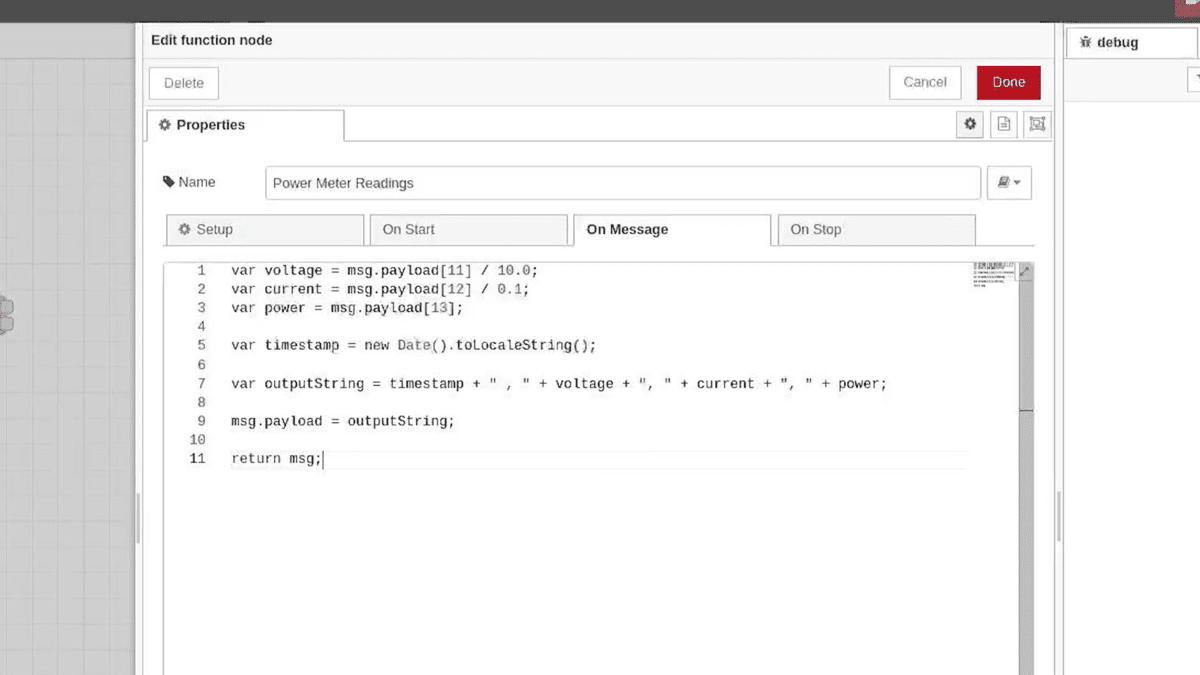
Now, we will need a function node, open its settings, and write the following code:
This code extracts voltage, current, and power values from a Modbus message payload, then, adjust their units, then, adds a timestamp, and formats the data into an object with Time, Voltage, Current, and Power fields before returning the modified message.
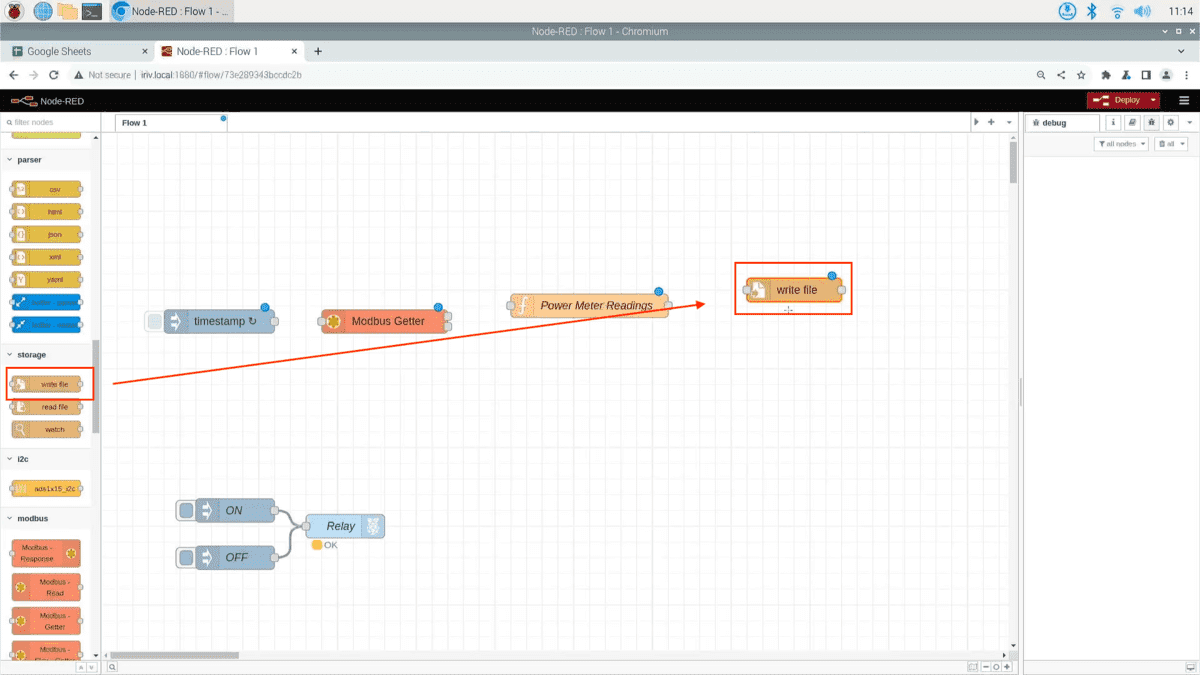
Next, we will need Write-File node, so we can save the readings into a CSV file.
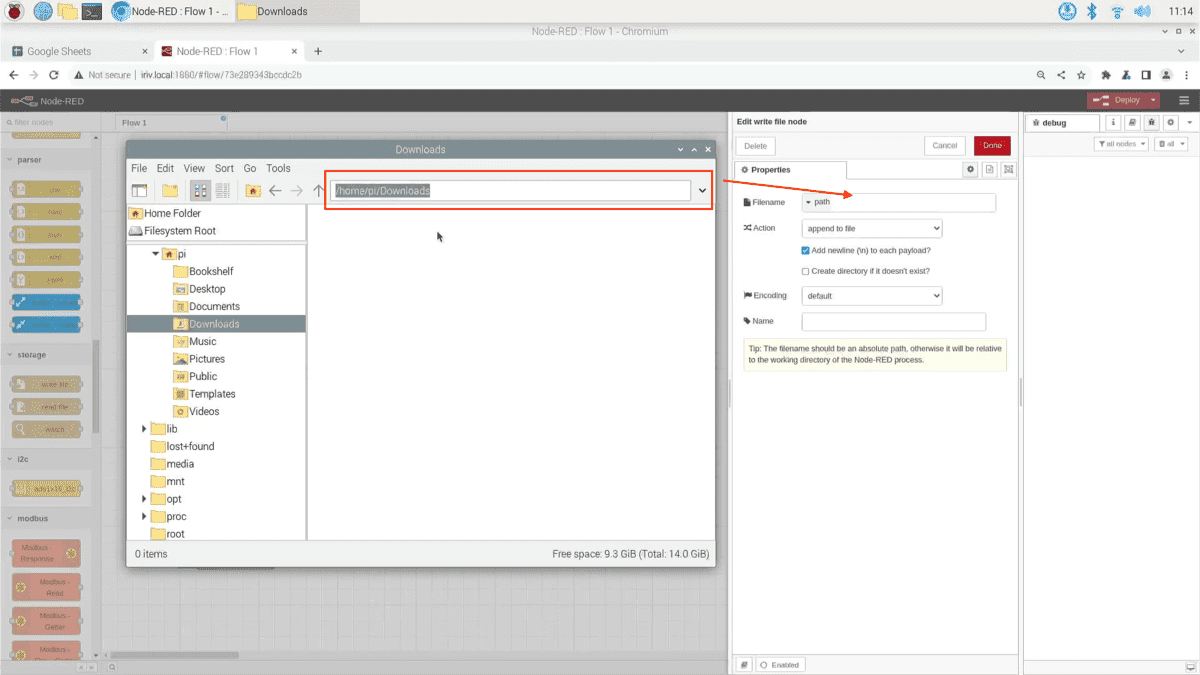
Once you open its properties, you will notice a section called Path, here you need to choose the path you want to save the CSV file at.
To do so, open the File Manager in your IRIV, choose the folder that you want to save your file at. For example I will choose the Downloads folder. At the top bar, you will see the folder path, copy it, then paste it in your node.
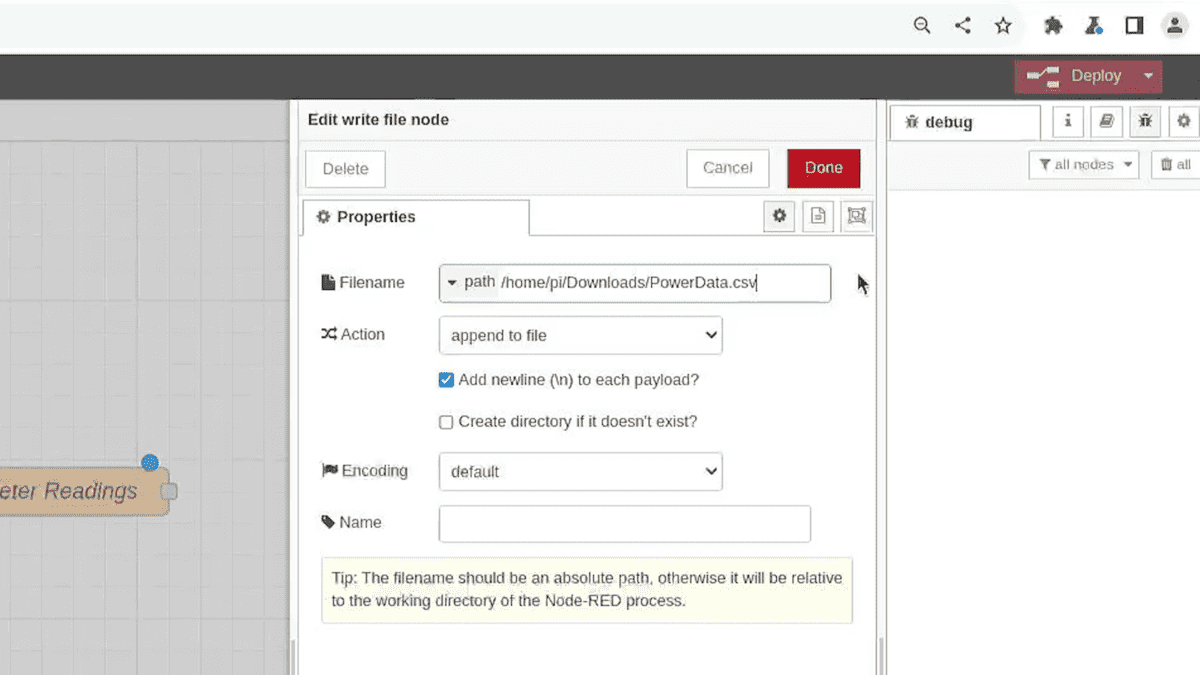
Then make sure to create the file by giving it a name with CSV extension. For example, the file name can be something like:
/home/pi/Downloads/PowerData.csv
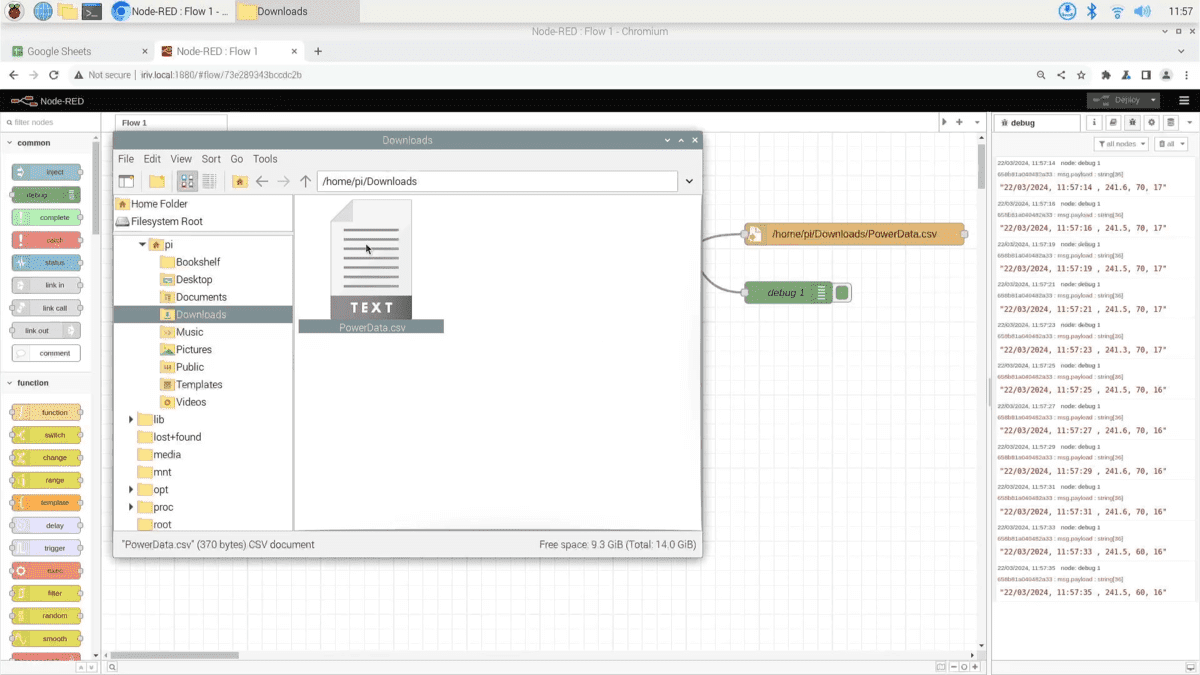
Before we see the file, let’s verify first that we are getting the readings from the nodes. Drag a debug node, then connect the nodes together this way. And hit Deploy.
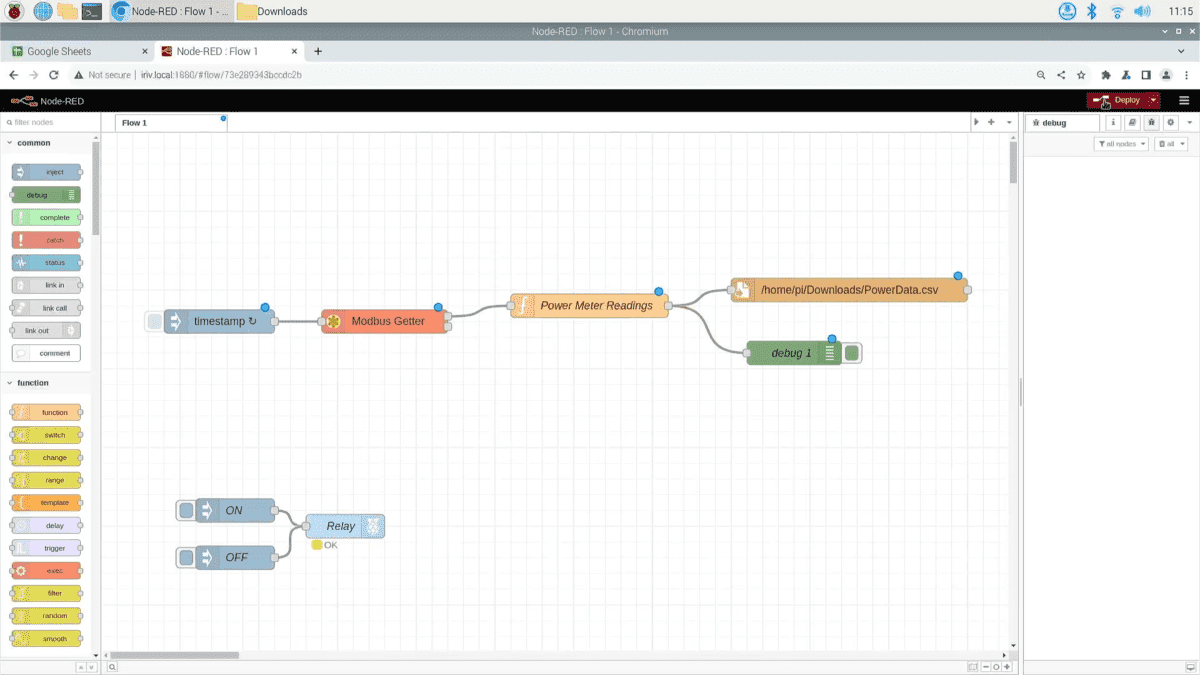
Now you will notice the power meter readings appear in the debug window.
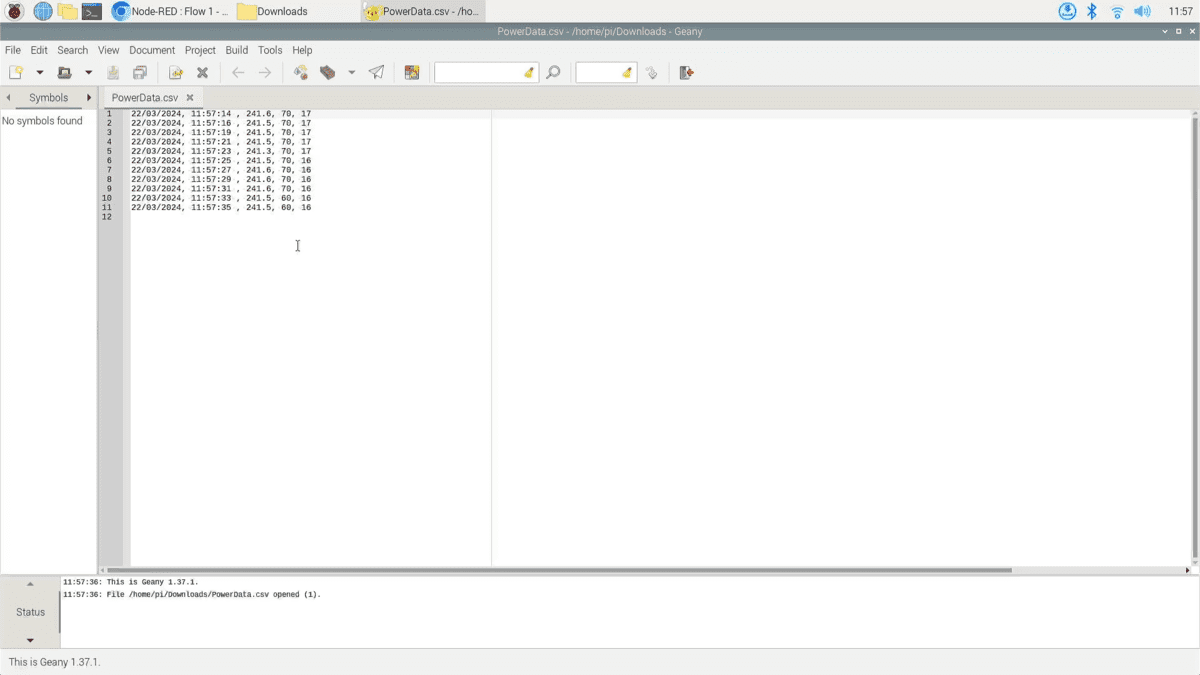
Next, navigate to your Downloads folder and you will see there the CSV file that we have created.
Open it and view the power meter readings. As you can see here, the data are formatted based on real date and time.
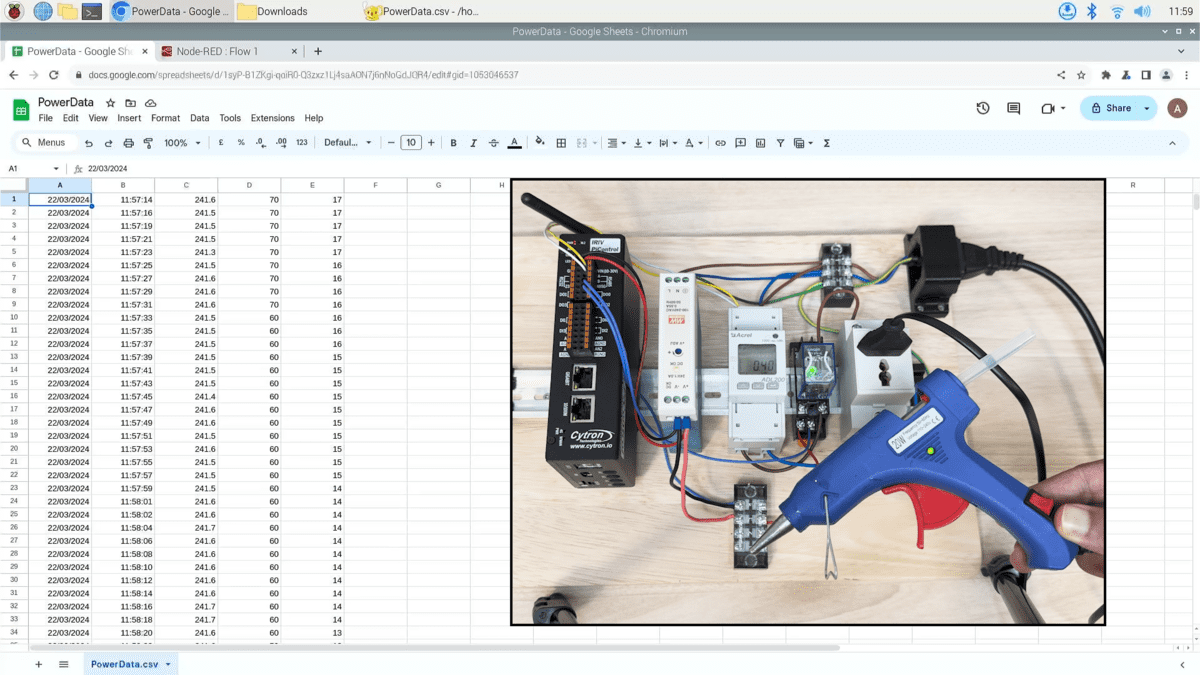
Tip: You can use Google-sheet to open this CSV file for better view experience.
That’s all for this tutorial, thanks for reading, and stay tuned for more.
Hardware Components

IRIV PiControl - IR4.0 CM4 Industrial Controller
RM1,345.00++
x 1 unit(s)